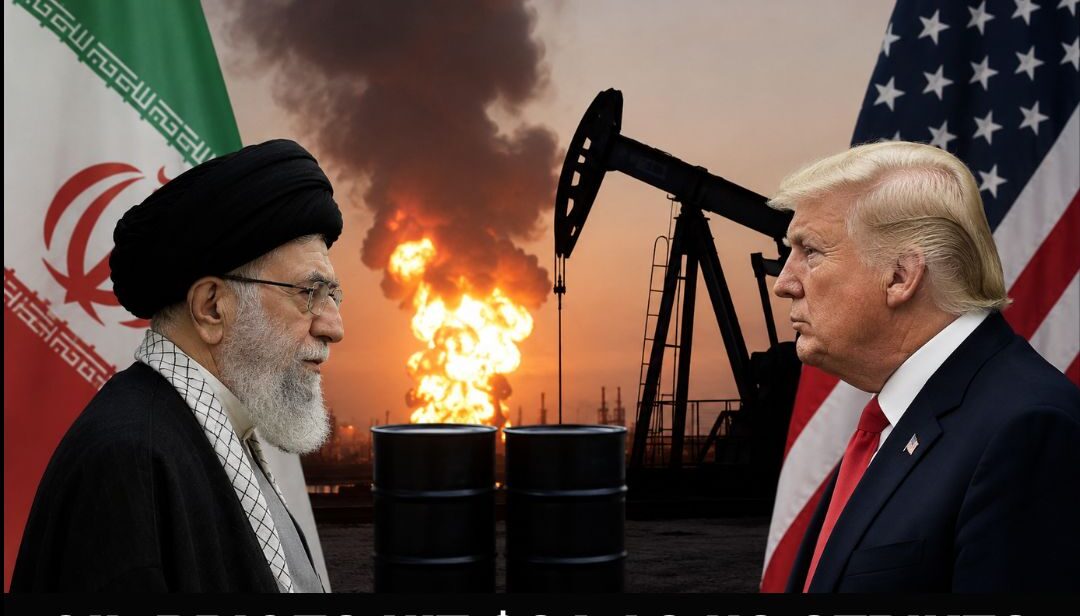
At 5:15 p.m. ET on Wednesday, June 10, the United States military launched its second consecutive day of strikes against Iran — 49 Tomahawk cruise missiles slamming into air defense systems, command-and-control nodes, ammunition depots, and surveillance infrastructure across southwestern Iran. By the time markets opened Thursday, Brent crude had climbed to $93.50–$95 per barrel, the Dow Jones had shed over 400 points, and Iran’s Foreign Ministry had declared that US attacks had “effectively rendered the ceasefire meaningless.”
The world’s most watched oil price had arrived, once again, at a familiar and dangerous junction.
How the Latest Strikes Unfolded
The trigger was precise: Iran shot down a US Army Apache helicopter over the Strait of Hormuz on June 9. Within hours, CENTCOM authorized retaliatory strikes, stating operations were “in response to Iran’s unwarranted and continued aggression.” The first wave hit at 5:00 p.m. ET on June 9. The second wave followed 24 hours later — broader, deeper, and targeting communications infrastructure within 40 miles of Tehran.
President Trump made no effort at diplomatic ambiguity. He warned Iran had “taken too long to negotiate,” threatened to hit the country “very hard tonight,” and stated his intention to “assume total control” of Iran’s oil and gas sectors — a declaration that landed in energy markets like a second missile volley.
Iran’s response was immediate. The IRGC launched ballistic missiles at a US airbase in Jordan and conducted drone strikes on US-linked installations in Bahrain and Kuwait. Foreign Minister Abbas Araghchi warned Iran would “leave no attack or threat unanswered.”
Oil Prices: From $71 to $94 — The Full Journey
To understand where oil prices are now, you need to understand how they got here. When Operation Epic Fury began on February 28 — with nearly 900 US-Israeli strikes in 12 hours killing Supreme Leader Ali Khamenei — Brent crude was trading at approximately $71 per barrel.
What followed was a textbook energy crisis in fast-forward:
- March 4: Iran declared the Strait of Hormuz closed. Brent surged past $120 per barrel.
- April 7: A Pakistan-brokered ceasefire took hold. Prices stabilized around $117/barrel through April.
- May average: Brent fell to $107/barrel as peace deal rumours circulated.
- May 23: Trump claimed a deal was “largely negotiated.” Oil pulled back further.
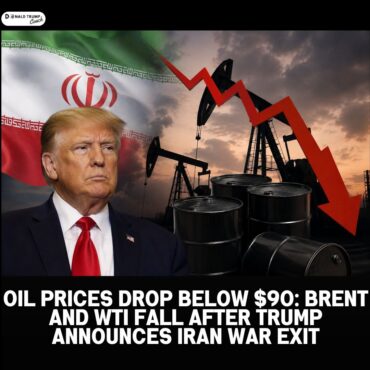
- June 9–10: Fresh strikes. Brent climbed back to $93.50–$95 — lower than the April peak, but reigniting volatility that markets had begun to price out.
The paradox: prices are lower now than they were in April despite fresh escalation. The explanation lies in what markets are pricing — not the current strike, but the probability of a ceasefire holding. Every round of strikes recalibrates that probability downward
Three Carriers, One Message
The scale of the US military presence in the region is itself a market signal. CENTCOM has deployed three aircraft carrier strike groups simultaneously in the Middle East — the USS Abraham Lincoln, USS Gerald R. Ford, and USS George H.W. Bush — the first time three carriers have operated concurrently in the region since the 2003 Iraq War. Combined, they represent 15,000+ naval personnel, over 200 aircraft, and roughly 14 acres of sovereign US territory afloat in one of the world’s most contested waterways.
The US naval blockade of Iranian ports — declared April 13 — formally ended May 29, but enforcement of freedom of navigation continues against Iran’s own closure declaration. With the IRGC still laying sea mines and attacking commercial vessels, the Strait remains closed to meaningful commercial traffic for the 103rd consecutive day.
What the Market Wants to Know: Where Does Oil Go Now?
Energy analysts have stress-tested every scenario. The range reflects genuine uncertainty about whether diplomacy or escalation takes hold from here.
Base case (Strait reopens in June, ceasefire stabilises): Brent eases from ~$106/bbl toward $89/bbl by Q4 2026. J.P. Morgan’s full-year 2026 forecast: Brent at $96/bbl, WTI at $89/bbl, fading to $75 and $70 respectively in 2027 as pre-conflict oversupply reasserts.
Delay case (25% probability — one-month slip in ceasefire or renewed escalation): Brent spikes to $138/barrel, WTI toward $119/barrel or beyond. Goldman Sachs specifically modelled that if Gulf exports don’t normalise until end of July with 500,000 bpd production cuts persisting, Brent breaches $120 within two months.
Extreme upside risk (prolonged closure past mid-summer): Brent climbs to $120–130/barrel with $150 not ruled out in Oxford Economics’ extended disruption modelling.
Bear case (20% probability — rapid deal and Strait reopening): Brent collapses to $65–80/barrel as pre-conflict oversupply floods back into markets.
The June 10–11 escalation has nudged the probability distribution away from the bear case and toward the delay scenario.
OPEC+ Watches Helplessly
Saudi Arabia and OPEC+ are caught in an impossible position. On June 7, the cartel approved its fourth output quota increase since the Strait closure began — raising Saudi Arabia’s official quota to 10.291 million barrels per day. In reality, actual OPEC+ production collapsed to 33.19 million bpd in April, down from 42.77 million bpd in February. The Strait closure has made paper quotas irrelevant — you cannot ship oil you cannot export.
Al Jazeera described the latest OPEC+ move as “largely symbolic.” Gulf oil states and Iraq are collectively losing an estimated $1.1 billion per day in stranded export revenue. Saudi Arabia is as much a hostage to the Strait’s closure as any Asian importer.
Markets React, Negotiations Stall
Beyond oil, Thursday’s market open told a broader story of risk-off sentiment. The S&P 500 dropped 0.7%. European and Asian indices fell 1–2%. The US dollar rose to a one-week high on safe-haven demand. Gold — which had climbed sharply after the February 28 strikes — fell for a third consecutive day, held below $4,100/ounce, as a stronger dollar offset geopolitical safe-haven demand.
On the diplomatic front, the Washington Post reported that Washington and Tehran are effectively “negotiating via ultimatums and attacks” — with no direct talks between the sides since April 11. Iran demands a halt to the US blockade and end to Lebanon hostilities. The US demands Iran surrender its nuclear material and formally renounce nuclear weapons development. The gap between those positions, as measured in Tomahawk missiles and ballistic rockets, has not narrowed.
What Happens Next
The honest answer, as of June 11: nobody knows. The ceasefire declared on April 7 technically remains in force — but Iran says it is “meaningless” after the latest strikes. Trump has made public threats of further escalation. Three carrier groups are positioned and ready. The Strait has been closed for 103 days.
NPR has reported that experts are increasingly worried the three-month closure is “setting a dangerous precedent” — normalising the weaponisation of the world’s most critical energy chokepoint. Every additional month of closure adds an estimated 2–3% to global inflation through compounding energy and shipping costs.