
Economy
India’s Economy Just Sent Two Totally Opposite Signals in One Week
NEW DELHI / NEW YORK – India’s economy grew 7.8% in the April–June 2026 quarter, easily beating the Reserve Bank of India’s 7% forecast. Yet the Indian rupee kept sliding against the US dollar, breaking past 96 per dollar on September 29 and hovering near its all-time low. For American readers, that looks like a…
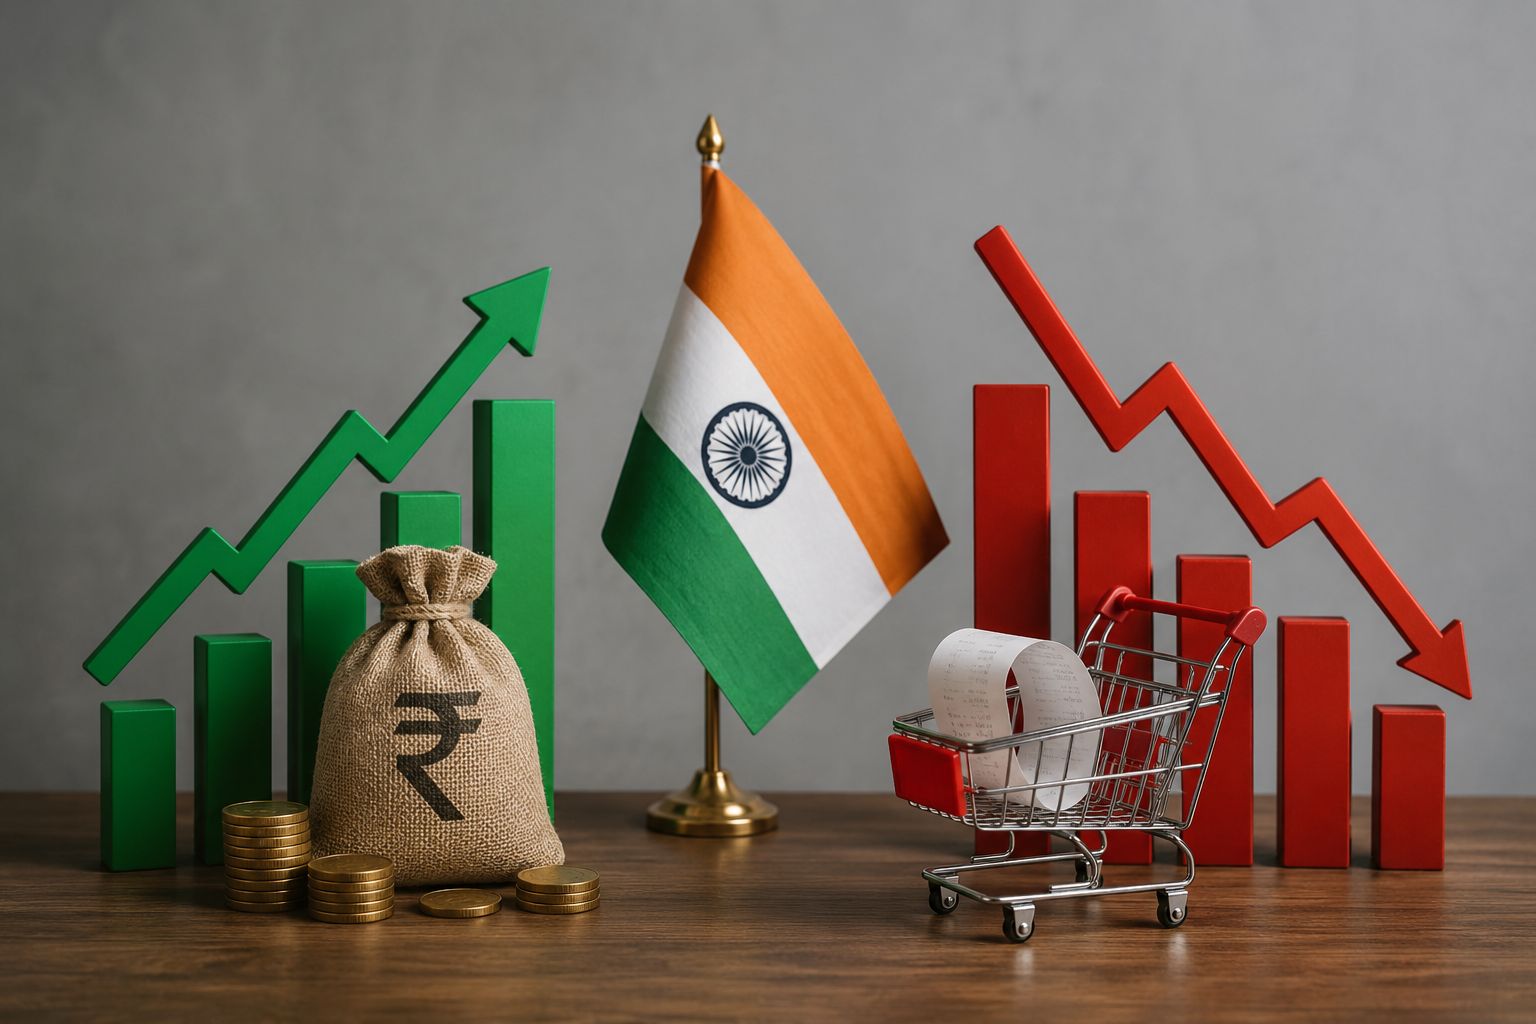
NEW DELHI / NEW YORK – India’s economy grew 7.8% in the April–June 2026 quarter, easily beating the Reserve Bank of India’s 7% forecast. Yet the Indian rupee kept sliding against the US dollar, breaking past 96 per dollar on September 29 and hovering near its all-time low.
For American readers, that looks like a contradiction. A booming economy is supposed to have a strong currency. In India right now, both headlines are true at the same time, and the reason runs straight through the Persian Gulf. For more on how the rupee got here, see our related coverage on the rupee’s historic low against the dollar.
Here is what happened, why it matters, and what to watch next.
Signal 1: India GDP Q1 FY27 Beat Every Major Forecast
India’s fiscal year runs April to March, so “Q1 FY27” means April–June 2026. The Ministry of Statistics (MoSPI) released the numbers on August 31: real GDP up 7.8% year over year, versus 6.9% in the same quarter last year. Economists polled by Reuters had expected about 7.1%.
India real GDP growth vs forecasts (%)
| Label | Growth (%) |
| Q1 FY26 (Apr–Jun 2025) | 6.9 |
| Q4 FY26 (Jan–Mar 2026) | 8.6 |
| Q1 FY27 (Apr–Jun 2026) | 7.8 |
| RBI forecast, Q1 FY27 | 7.0 |
| RBI forecast, full FY27 | 6.7 |
The growth was broad, not a one-sector fluke:
- Manufacturing grew 9.2%, a three-quarter high, led by infrastructure, data centers, power and metals.
- Services grew 10%; the finance, real estate, IT and professional services group grew 12.1%.
- Investment (gross fixed capital formation) jumped 11.9% in real terms, about double last year’s pace, lifting its share of GDP to 34.3%.
- Nominal GDP grew 10.3%, an eight-quarter high.
The weak spots were smaller. Agriculture slowed to 3.6% and mining shrank 2.4% against a high base. Growth also cooled from the 8.6% pace of January–March 2026.
Q1 FY27 growth by sector (%)
| Sector | Growth (%) |
| Investment (real GFCF) | 11.9 |
| Services | 10.0 |
| Manufacturing | 9.2 |
| Agriculture | 3.6 |
| Mining | -2.4 |
Prime Minister Narendra Modi called the result a “herculean feat.” The opposition Congress party argued the headline hides weak private investment sentiment, falling household savings and record household debt.
Modi has been actively courting international partners during this stretch too, including recent outcomes from his visit to Sweden, part of a broader push to line up foreign investment and strategic ties even as the rupee struggles.
Signal 2: The Rupee Is Stuck Near Its Record Low
The rupee set its all-time low on May 20, 2026, touching about 96.95 per dollar after nine straight losing sessions. After a summer of partial recovery, the slide resumed after the GDP release.
On September 29 the rupee broke past 96 per dollar intraday, hitting 96.15 before closing flat at 95.99 on central bank dollar sales. Since January it has lost 6.49% against the dollar, and it has also weakened against the yen, pound and euro.
Rupee per US dollar, key 2026 points (higher = weaker rupee)
| Date | INR per USD |
| Early March | 91.30 |
| May 20 (all-time low, intraday) | 96.95 |
| September 17 (seven-week low zone) | 96.10 |
| September 29 (intraday low) | 96.15 |
| September 29 (close) | 95.99 |
That last point matters. This is not just a strong-dollar story. The rupee is losing ground against almost everyone.
Track the Story
Live Oil Price Tracker →
Oil is the single biggest driver of the rupee’s slide, track Brent and WTI in real time to see where this story goes next.
Live Trump Tariff Tracker →
See how shifting US trade policy is adding to, or easing, pressure on economies like India’s.
For the full picture on where this story is headed, visit DonaldTrump.Coach.
Why Is the Rupee Falling If GDP Is Growing?
GDP measures what India produces. The exchange rate measures how many dollars flow in and out. Those two can move in opposite directions, and in 2026 three forces are pulling them apart.
1. The oil bill from the West Asia war. India imports most of its crude and pays for it in dollars. When the Iran Israel US conflict began in February, India’s crude basket averaged $69 a barrel. It jumped to $113 in March and reached $116 by September 29. Crude and fuel products now make up nearly a quarter of India’s total imports. Every extra dollar spent on oil means more rupees sold for dollars.
Indian crude basket price, 2026 ($/barrel)
| Point | Price ($/bbl) |
| February (war begins) | 69 |
| March | 113 |
| September 29 | 116 |
2. Foreign money leaving. Global investors sold Indian stocks and bonds as risk rose and US interest rates stayed high. The Federal Reserve raised rates in mid-September, which made dollar assets more attractive.
3. A shrinking cushion. The Reserve Bank of India has been selling dollars to slow the fall. India’s reserves dropped $14.88 billion in the week covering September 18, to $765.9 billion, the steepest weekly drop since late 2024.
There is good news inside the flows. Foreign direct investment hit $7.4 billion in July, the highest monthly inflow in five years. Long-term investors are still buying India’s growth story. Short-term money and the oil bill are simply bigger right now.
That is the real impact of the Iran Israel US war on India’s economy in 2026: it has not stopped growth, but it has made that growth more expensive in dollar terms.
India’s Economy Rank in 2026 and GDP Per Capita
The weak rupee has a direct cost for India’s global ranking, because rankings compare economies in US dollars. In 2025, Indian officials said India had passed Japan as the world’s fourth-largest economy. The IMF’s April 2026 outlook instead placed India sixth, at about $4.15 trillion for 2026–27, just behind the UK at $4.26 trillion.
Two things drove that: a GDP base-year revision in February that lowered India’s nominal size, and the rupee’s fall. The IMF now projects India reaching fourth place only in 2028.
India’s GDP per capita tells the other half of the story. At roughly $2,880 per person, India’s average income is a small fraction of Japan’s $33,900, and India has about 1.46 billion people. India is a very large economy that is still a lower-middle-income country per person.
Is India’s Economy Slowing Down?
Not yet, but the pace is expected to ease. The RBI forecasts 6.7% growth for the full FY27 year, well below the 7.8% first-quarter print; CareEdge Ratings is more upbeat at 7.3%. The RBI held its policy rate at 5.25% in August and expects inflation near 5.9% late this year, which has some analysts talking about a rate hike.
What to watch over the next few months:
- Oil prices. A ceasefire or supply relief in the Gulf is the fastest route to a steadier rupee.
- RBI moves. A rate hike could support the rupee but slow borrowing and growth.
- El Niño. The Finance Ministry has flagged risks to winter crops, which could push food prices up.
- Foreign reserves. A continued fast drawdown would signal the RBI is under strain.
What It Means for Americans
American travelers now get more for their dollar in India than at almost any time in history. US companies that buy Indian IT services, pharmaceuticals or manufactured goods also benefit, since a cheaper rupee lowers their costs. Investors holding Indian stocks face the flip side: strong earnings growth can be partly erased when returns are converted back into dollars.
The bottom line: India’s economy is growing fast in rupees and struggling in dollars. Which signal wins depends less on New Delhi than on the price of a barrel of oil.
Frequently Asked Questions
What was India’s GDP growth in Q1 FY27?
India’s real GDP grew 7.8% in April–June 2026 (Q1 FY27), above the RBI’s 7% forecast and up from 6.9% a year earlier.
Why is the rupee falling if GDP is growing?
GDP tracks output; the rupee tracks dollar flows. High oil import bills, foreign investor outflows and higher US interest rates are pushing more dollars out of India than growth brings in.
Is India’s economy slowing down?
Not sharply. Growth eased from 8.6% in January–March to 7.8% in April–June, and the RBI expects about 6.7% for the full fiscal year.
What is the impact of the Iran–Israel–US war on India’s economy in 2026?
The war pushed India’s crude basket from $69 to $116 a barrel, widened the import bill, fed inflation and weakened the rupee about 6.5% against the dollar this year, while overall growth stayed strong.
What is India’s GDP per capita?
About $2,880 per person, based on IMF figures for 2026, which keeps India in the lower-middle-income group despite its large total economy.
What is India’s economy rank in 2026?
The IMF’s April 2026 data places India sixth by nominal GDP, behind the UK, and projects it to reach fourth place in 2028.
What is India’s record low against the dollar?
The rupee’s all-time low is about 96.95 per dollar, touched intraday on May 20, 2026. It broke past 96 again on September 29.
References and Sources
- India’s Q1 FY27 GDP grows 7.8%, beats RBI’s 7% forecast – EcoNiti, Sep 1, 2026 (MoSPI data summary, sector growth, RBI forecast)
- India’s GDP Grows 7.8% In Q1 FY27, Beats Expectations – Storify News (Reuters consensus, official reactions)
- Rupee slips 13 paise to hit fresh lifetime low of 96.83 against US dollar – Deccan Herald / PTI, May 20, 2026
- Rupee recoups intraday losses as RBI intervenes through dollar sales – Business Standard, Sep 29, 2026
- Datanomics: Rupee feels the heat from crude oil, weakens beyond the dollar – Business Standard, Sep 30, 2026
- Indian Rupee draws support from RBI’s intervention near seven-week low – FXStreet, Sep 17, 2026
- RBI Intervenes as Forex Reserves Fall Sharpest in 2 Years – Briefs, Sep 2026
- Rupee Slips as Oil Prices Climb Despite Record FDI – Whalesbook, Sep 2026
- Far From Being the ‘Fourth Largest’, India Slips to Number Six on Global GDP Rankings– The Wire, Apr 16, 2026 (IMF April 2026 WEO ranking, per capita)
- India’s GDP revisions mean it will take longer to overtake Japan – The Japan Times, Feb 28, 2026