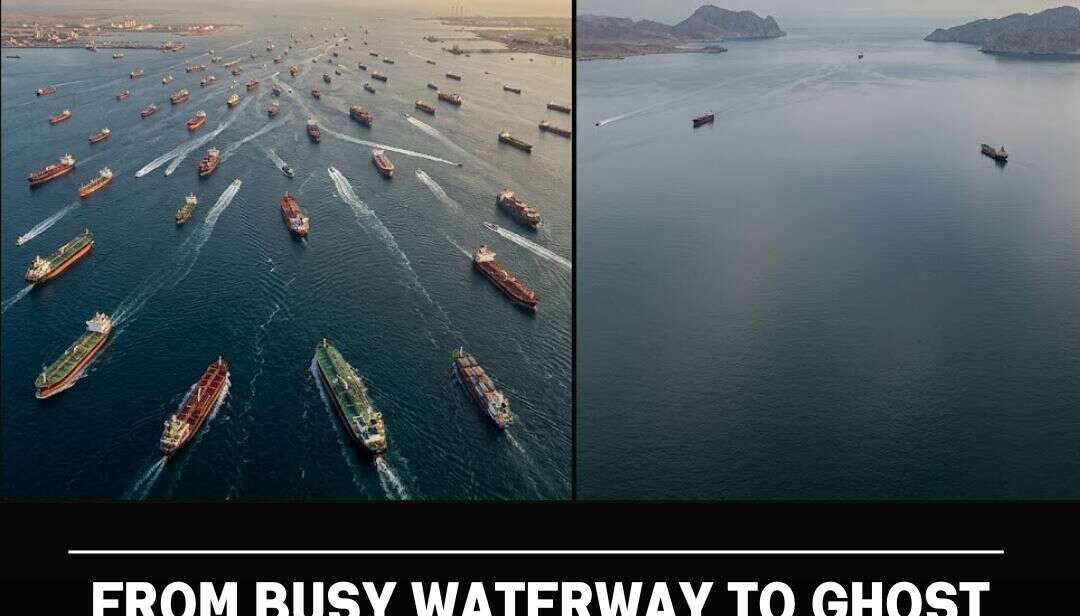
On the morning of February 28, 2026, 105 ships passed through the Strait of Hormuz — a tight but unremarkable day for one of the most trafficked maritime chokepoints on Earth. By March 2, that number had crashed to 13. Within weeks, the strait of Hormuz traffic had all but vanished from tracking screens worldwide.
On the morning of February 28, 2026, 105 ships passed through the Strait of Hormuz — a tight but unremarkable day for one of the most trafficked maritime chokepoints on Earth. By March 2, that number had crashed to 13. Within weeks, the strait of Hormuz traffic had all but vanished from tracking screens worldwide.
What followed was not just a shipping disruption. It was the near-total erasure of a waterway that, until days before, carried roughly 20% of the world’s oil and natural gas to markets across Asia, Europe, and beyond.
What Normal Looked Like
Before the U.S.-Israeli strikes on Iran triggered the current crisis, the Strait of Hormuz was a relentless engine of global energy trade. According to Lloyd’s List Intelligence, approximately 3,000 vessels transited the strait every month — or about 100 ships per day. The International Energy Agency recorded an average of 20 million barrels per day of crude oil and oil products flowing through this 24-mile-wide chokepoint in 2025 alone.
For countries like Iraq, Kuwait, Qatar, and Bahrain, the strait was not optional — it was existential. Over 80% of the oil and LNG moving through it was destined for Asia, with China importing as much as 40% of its oil and 30% of its LNG through this corridor.
Marine traffic data from IMF PortWatch confirmed the baseline: 129 vessels per day were transiting Hormuz in the final weeks of February 2026, just before the conflict ignited.
The Collapse, Day by Day
The numbers tell a story that no headline fully captures.
Feb. 28: 105 vessels transited — 68% of normal volume, as news of the strikes spread and operators grew cautious.
March 2: Just 13 transits recorded. A single oil tanker. AIS signals went dark across the strait near midnight as Iran confirmed it had closed the waterway.
March average: Six ships per day — less than 6% of the pre-war baseline.
April: Only 191 total vessel crossings logged for the entire month, per analytics firm Kpler.
That final figure is perhaps the starkest. A waterway that once saw 3,000 transits per month was now averaging fewer than seven per day.
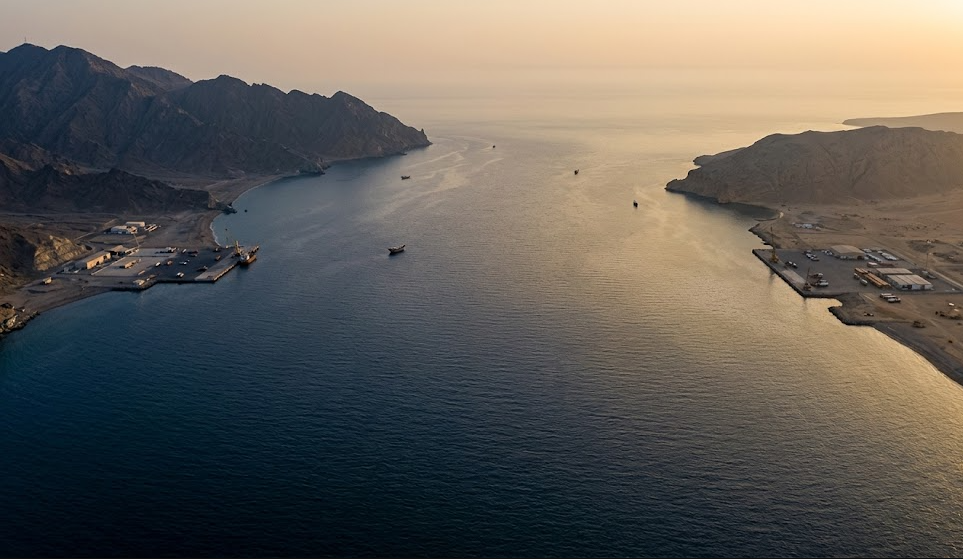
Marine traffic in the Strait of Hormuz didn’t just slow — it effectively stopped.
Why Ships Stopped Moving
Iran’s response to the strikes was swift and layered. The Islamic Revolutionary Guard Corps (IRGC) issued warnings forbidding passage, boarded and attacked merchant ships, and reportedly laid sea mines in the strait. War risk insurance — critical for any commercial operator — was removed for departures after March 5, making the economic calculus impossible for most shipowners.
The IRGC later published a new routing map, designating a so-called “alternative corridor” that channeled vessels through Iranian territorial waters past Larak Island — enabling Iranian navy checks and, crucially, the collection of transit tolls exceeding $1 million per ship.
As CNN’s shipping analysts noted, the official IMO shipping lane was “almost entirely abandoned,” while a significant share of traffic continued operating “dark” — with AIS transponders switched off to avoid detection.
Even after a two-week ceasefire was announced on April 8, the recovery was illusory. Just five vessels crossed the day after the truce, and seven the day after that. Over 600 vessels — including 325 tankers — remained stranded inside the Persian Gulf, according to Lloyd’s List Intelligence.
A Dual Blockade and Its Price
The crisis deepened on April 13, when the United States announced a naval blockade of all ships entering or leaving Iranian ports, following the collapse of the Islamabad peace talks. The result, described by The Guardian as a “dual blockade,” left the strait effectively controlled from both ends — Iran throttling inbound traffic, the U.S. Navy intercepting outbound vessels.
U.S. Central Command confirmed it had directed at least 38 vessels to turn around since the blockade began. Brent crude, the international oil benchmark, climbed to $96 per barrel — a sharp spike from pre-conflict levels — reflecting what Kpler’s lead oil analyst Matt Smith described plainly: “It’s about a third of the world’s seaborne crude that is passing through there — 15 million barrels per day. And now it’s basically slowed to a trickle.”
Shortages of refined products have been felt most acutely in Asia, where energy import dependency on Gulf supplies is highest.
When Will Normal Return?
Prediction market platform Kalshi, which tracks trader sentiment on geopolitical outcomes, currently assigns a 57% probability that normal strait of Hormuz traffic resumes by September 1, 2026 — with “normal” defined as a 7-day moving average exceeding 60 daily transits. As recently as late April, the market had expected a July reopening. That window has now shifted.
Traders give 76% odds that full traffic recovery won’t occur until January 1, 2027 or later.
For global energy markets, the longer the marine traffic in the Strait of Hormuz stays suppressed, the more severe the downstream consequences — from Asian fuel shortages to elevated oil prices that ripple into food costs, freight rates, and inflation worldwide.
The Chokepoint That Changed Everything
What the data reveals is a transformation that happened with stunning speed. The Strait of Hormuz went from averaging 100+ vessel transits daily to single-digit crossings — not over months, but over days. The infrastructure of global energy trade did not gradually weaken. It was switched off.
Understanding the scale of that shift, in data and on maps, is the first step to grasping what a prolonged closure truly costs the world.
Market Analysis
A quick snapshot of market trends, customer behavior, and competitor movements.